These Power BI dashboards are a part of my full portfolio.
Introduction
Here are embeds to Power BI Reports/Visualisations I’ve done.
Built using
- Power Query editor to transform data
- Power BI Desktop to build interactive visualisations
These embedded Power BI reports are interactive.
Feel free to click on elements within them to filter other visualisations within the same report.
Note that these Power BI reports are best viewed on a desktop and in full-screen mode.
Superstore Sales Analysis
Grocery Sales Data
Data Professional Survey
IT Expenditure
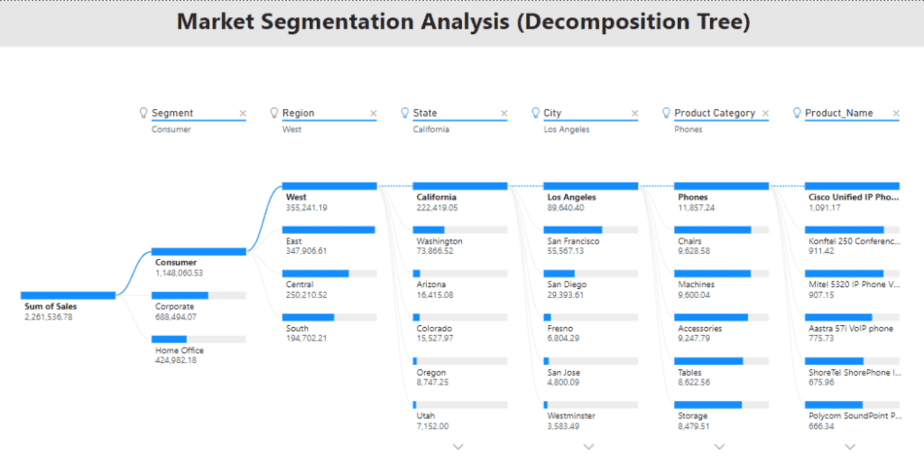
Beyond just interactive reports/dashboards, I can also perform a Market Segmentation Analysis using a decomposition tree – right within Power BI.
Here’s what it looks like for the Superstore Sales Analysis I did.
This helps business leaders understand their Ideal Customer Profile (ICP), including what they purchase the most and from where.