
Note: These Tableau dashboards are a part of my full portfolio.
Introduction: Why Birds?
“Data are just summaries of thousands of stories—tell a few of those stories to help make the data meaningful.”
~ Dan Heath, bestselling author
I’m super passionate about birds. 🐦
I love their biodiversity and their readily available presence.
Also, there is A LOT OF DATA about them, and their behavioral patterns are not very studied.
I scoured through forums and Google Search and couldn’t find definite answers to questions people had about their behaviours (many bird watchers were curious!)
That’s why I created an entire website called Birding Outdoors + these data visualisations via Tableau Desktop to find out problems regarding birds.
Tools used:
- R for reading and aggregating large datasets (>9M rows)
- Tableau Desktop for building data visualisations
- Excel for quick viewing of smaller datasets
In fact, more than 100,000 people have seen them on my Tableau Public profile.
I sought to discover the behavioral patterns of birds in 5 separate studies:
- Bird feeding patterns: Where and which birds feed at feeders 🥜
- Bird hatching patterns: How long eggs take to hatch 🥚
- Bird nest survival patterns: Which birds survive better in their nests and how long 🪺
- Bird fledging patterns: How long they take to learn to fly 🪽
- Bird strike patterns: Birds that die from colliding into an airplane 🛫
To best appreciate the Tableau dashboard embeds, please view this on a desktop device.
Study 1: Bird Feeding Patterns🥜
I gathered data from FeederWatch, a known citizen science platform, with data from birdwatchers in the US.
I sought to answer a few common questions about bird feeding:
- How Many Bird Feeders Owners Own: Complete newbies wanted to know it to get started bird feeding
- Geographical Location of Feeders: Newbies wanted to know about birds in their state
- Bird Feeder Finding Duration: Newbies were clueless about how long birds will take to discover their feeders
- Time of Day that Birds Feed: Newbies wanted to spot birds at their feeders!
Here are the four visualisations I built for individual blog posts on Birding Outdoors:
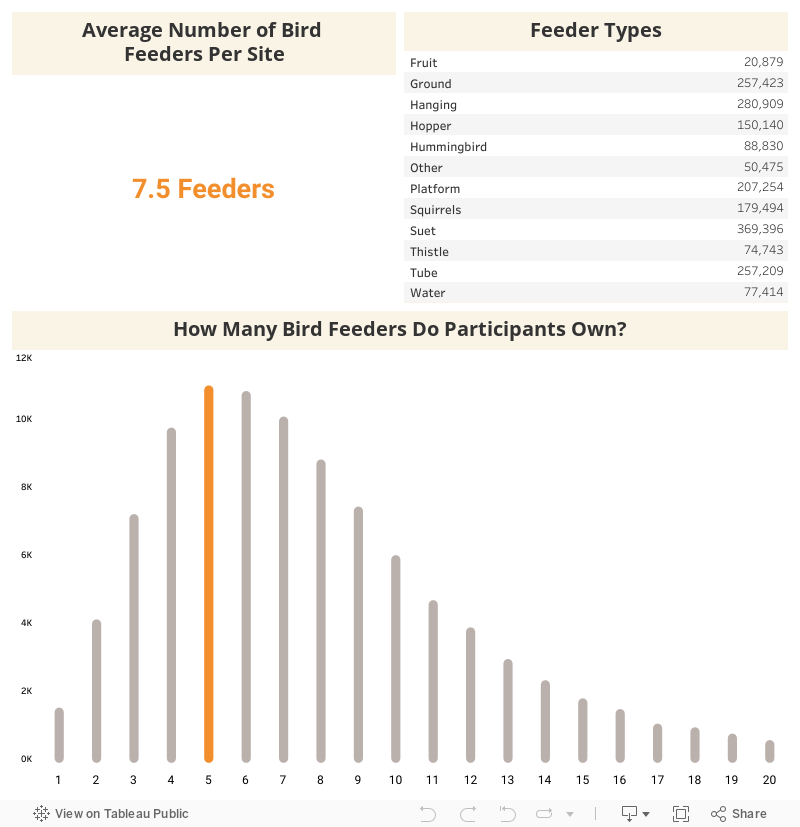
Looks like the mean (7.5) and the median (5) number of bird feeders based on my analysis was slightly different.
Having this amount of bird feeders in a typical backyard is common as different feeders attract different birds,
So owners need to deploy multiple types to attract a wide variety of them.
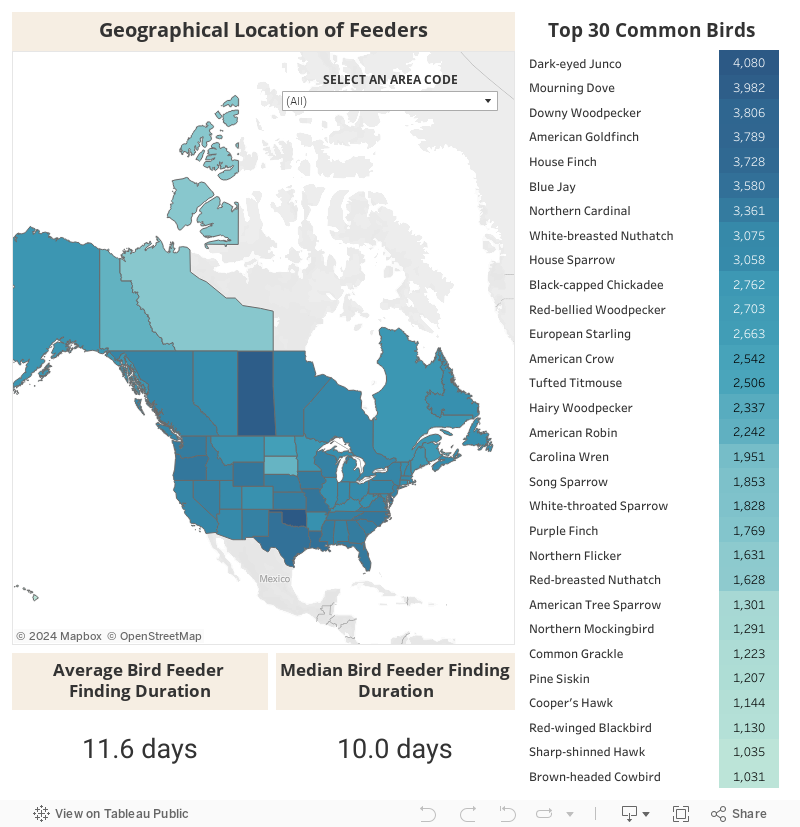
To calculate the duration of how long birds take to find a feeder, I subtracted the date that the bird was first seen at a feeder from the date the feeder was first setup.
Based on population alone from the data, Dark-eyed Juncos seem to be the most commonly seen birds at bird feeders.
Interestingly, different birds take different durations to find a feeder.
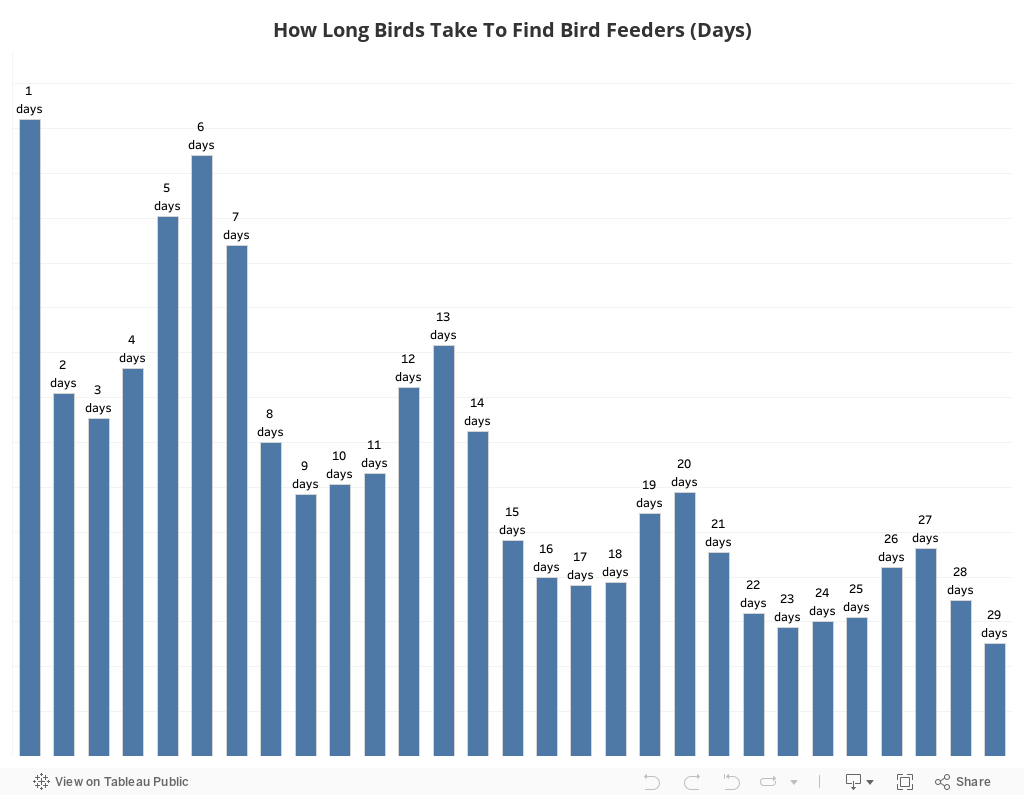
To investigate the distribution, I plotted a histogram of the duration birds take to find feeders.
Upon inspection below, we see that there is a weekly trend. More birds found feeders on roughly the 1st, 7th, 14th, 21st, and 28th days after a feeder is first placed.
I suspect this could be due to the owners only having the time to record findings on the weekends, as this is citizen science, not a scientific experiment with controlled variables.
We can also see that the distribution of how long birds take to find feeders is wide. Here are a few insights gained:
- There are early arrivers and late arrivers. Some birds find feeders fast, and some slow
- There are early migrators and late migrators. More birds migrate earlier in the migration seasons and less later.
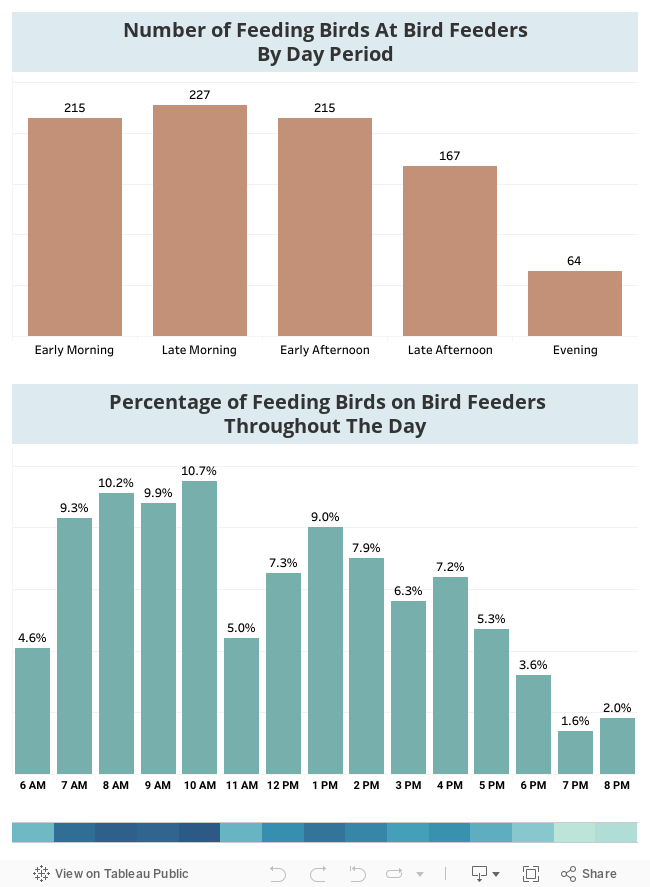
Touching on the feeding patterns, the time of day matters a lot.
The top graph shows findings by time period and the bottom, the distribution by the hour.
Most birds like to feed in the mornings, from 8 – 10 am. This makes sense, as it is less hot during those hours. Also, they feed at 1 – 2 pm in the afternoon.
Study 2: Bird Hatching Patterns🥚
Next, I studied how long birds take to hatch.
Many curious birdwatchers have seen nests during the breeding season (March – June) and saw eggs. They wondered how long it would take to hatch.
Here’s a visualisation I came up with – simple, but thousands loved it!
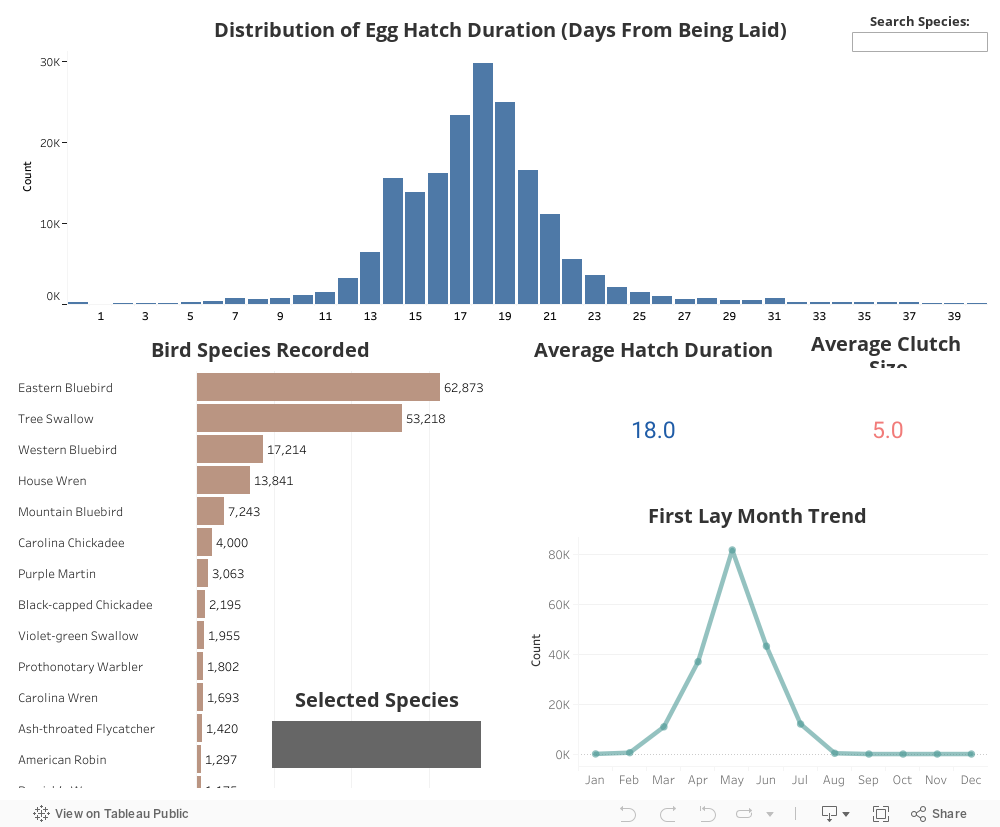
We see a beautiful normal distribution of the amount of time eggs take to hatch across all the birds.
We also see that May was the month that most eggs were laid by birds. This coincides with the Spring migratory period of birds.
When observing different individual bird species, we can see that some birds lay eggs earlier in the season and some later in the season. These are known as early nesters and later nesters.
Step 4: Bird Nest Survival Patterns 🪺
Not all eggs that are laid get to hatch and survive. Predators like domestic cats, birds of prey, and other factors such as disease affect survival rates.
I wanted to do a study on how many actual birds survive.
I tracked the means of 3 separate metrics:
- Egg Survival Rate (ESR)
- Nestling Survival Rate (NSR)
- Overall Nesting Survival Rate (ESR + NSR combined)
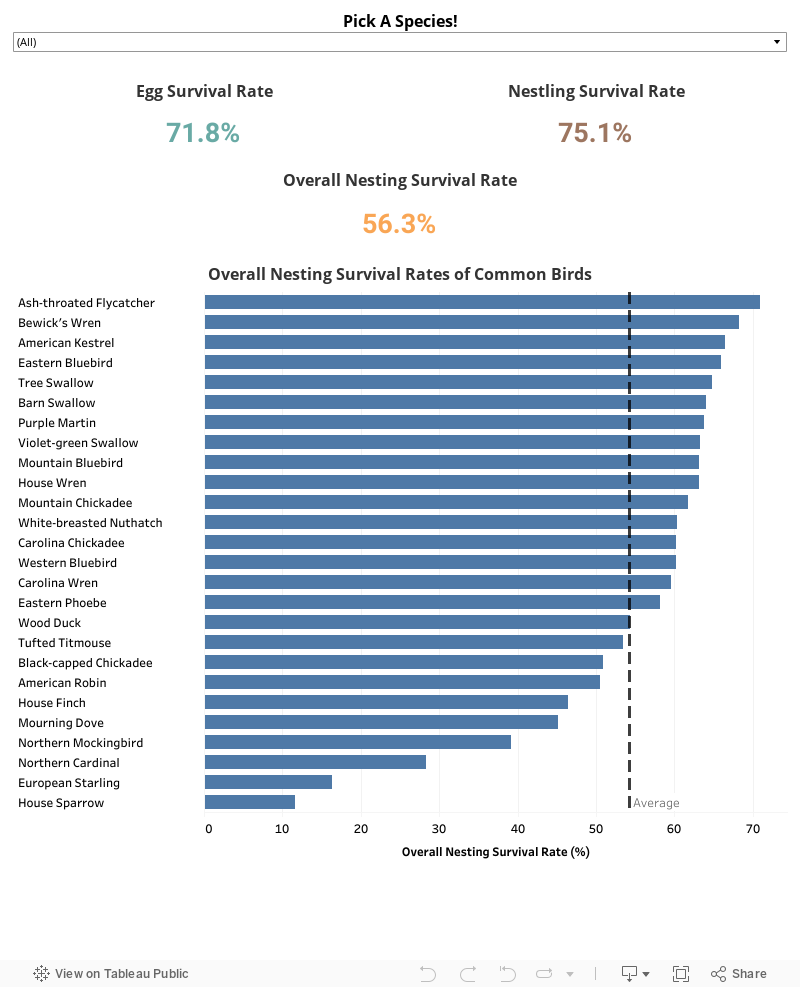
As it turns out, the overall nesting survival rate is just 56%!
This low number might be due to birds not surviving past the egg, nestling, and fledgling stages of their life cycle.
However, once they survive past the egg stage (71.% survival rate), they have a slightly higher survival rate of 75.1%.
Do note that this number might be skewed due to some species being more common/more observed than others.
Of course, more can be done to study the median survival rate for each species.
Step 4: Bird Fledging Patterns🪽
To fledge is to learn to fly.
Birds, for a certain period of time will be grounded or seen hopping around or from branch to branch; their wings are not fully developed to fly yet.
Birds like these are called fledglings.
Many online birdwatchers wanted to know how long they took to take flight!
Here’s a viz I did for it:
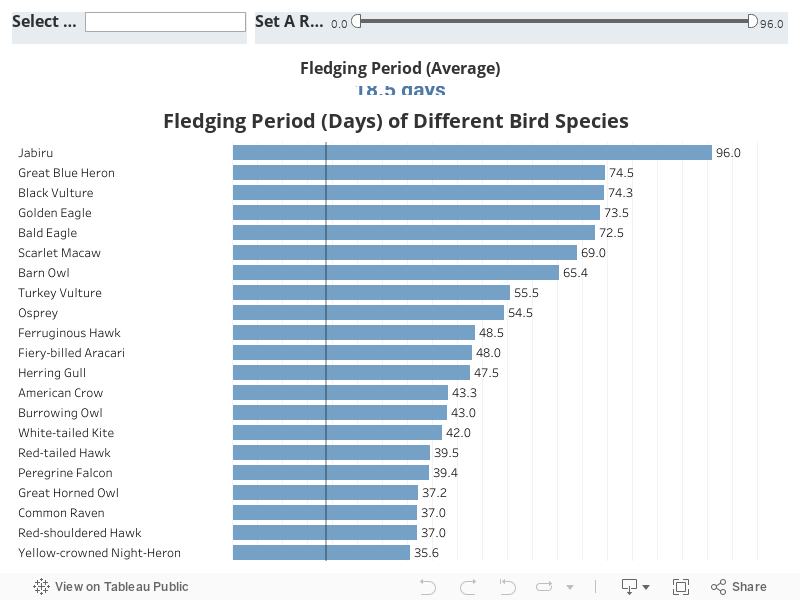
There’s a wide distribution of birds learning to fly: from 12 – 21 days. (Based on the Lower Hinge and Upper Hinge of the boxplot)
Some bird learn to fly or are at least observed to be flying for the first time really quickly within just one day and some over three months.
In future studies, I would recommend merging a dataset of the average weight of these same bird species to investigate the correlation between weight and how long they take to learn to fly for the first time.
Study 5: Bird Strike Patterns
This was a study I did years back when I was learning about bird strikes.
Bird strikes are phenomenons where birds fly into aviation machines by mistake.
I wanted to investigate this by doing up a nice viz to showcase the bird strike patterns across the US states.
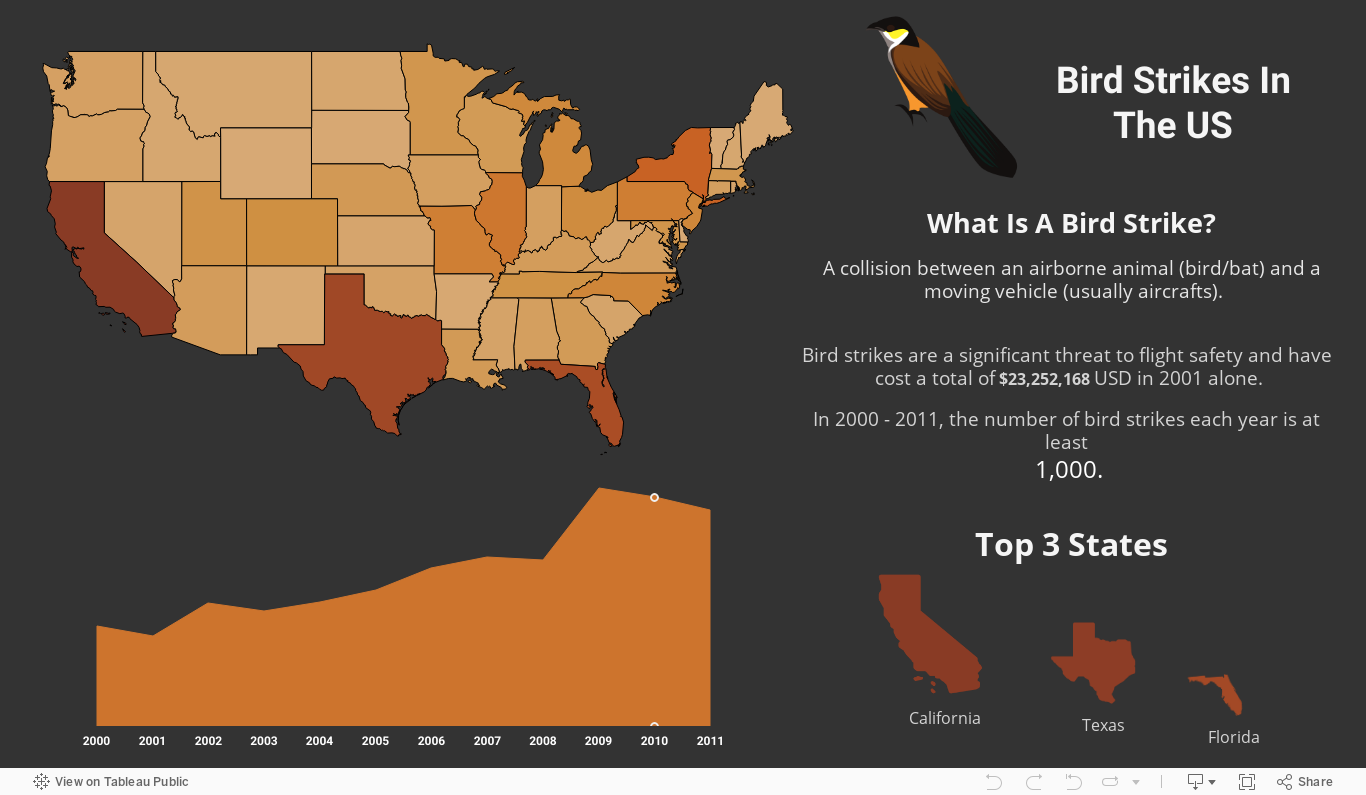
It seems that California, New York, Texas, and Florida are the states that showed the most number of bird strikes.
This might be attributed to more cities and airplane flight paths in those regions, leading to more bird strikes.
However, the data for this is not up to date.
Study 6: Bird Collisions 🪟
Birds can’t tell the difference between super clear windows and the actual air.
So, they fly into them.
The unfortunate bird is then known to have had a collision.
To learn more about bird collisions, I did a separate study on bird collisions data:
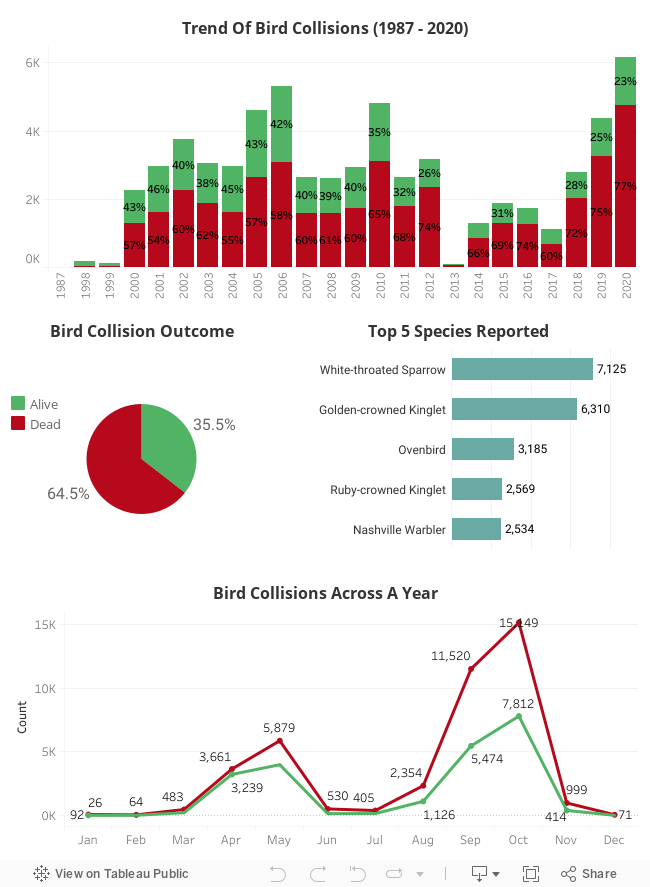
Unfortunately, most birds (64.5%) die upon impact.
The biggest victim is the White-Throated Sparrow.
We can also see a pattern where bird collisions follow the seasonality of migratory periods of Spring (Mar – Jun) and Fall (Aug – Nov).
Conclusion
Thanks for reading until the end.
I hope you find these studies of bird-related data insightful! These were made to showcase my skills in R and in Tableau Desktop.